
Identification and physiochemical characteristics of RsDofs in radish
Through comprehensive searching of the radish genome using HMM with the Dof domain (PF02701), 59 RsDof family members were identified, and further validation via SMART, Prosca, and CDD. Following the distribution of Dof genes of their closet orthologs in A. thaliana, RsDofs were named RsDof1 to RsDof36-b. Their responding physical and chemical properties were identified as varied in those RsDofs and shown in Table S2. Analysis of RsDof proteins showed that lengths of amino acid, molecular weights, and isoelectric points ranged from 167 to 437 aa, 18.9 to 431.5 kDa, 4.81 (RsDof2) to 9.9 (RsDof7-a) respectively. Subcellular localization prediction indicated that 46 RsDof proteins were localized in the nucleus, while the remaining proteins were found in the chloroplast (9), mitoplast (2), and cytoplasm (1). Additionally, to investigate the sequence characteristics of RsDof proteins, a multiple sequence alignment analysis was performed to construct the Dof structural domain using Clustal W. It is indicated that the typical CX2CX21CX2C motif was highly conserved contained in RsDof ‘proteins’ structural domain sequences, where four Cys residues could be covalently combined by Zn2+ (Fig. 1).
Multiple sequence alignment of Dof domain for RsDof proteins in radish. (A) Extraction of conserved domains of Dof proteins (B) the conserved domains shown by WebLogo.
Phylogenetic analysis and classification of RsDofs
A comprehensive analysis of the evolutionary relationships among RsDof proteins involved the alignment of 572 Dof protein sequences from Arabidopsis (36), Brassica napus (112), and Radish (59 identified RsDofs) to construct a phylogenetic tree (Fig. 2). The resulting phylogenetic tree delineated the RsDof homologs into nine groups (A to I), further subdivided into 14 subgroups: A1, A2, B, C, D1, D2, D3, D4, E1, E2, F, G, H, and I (Fig. 2). Group A emerged as the largest clade encompassing 56 members, while Group B represented the smallest clade with only seven members. Notably, a significant proportion of Dofs from O. sativa and S. bicolor clustered within Group F, indicating their close evolutionary relationship as grass species.
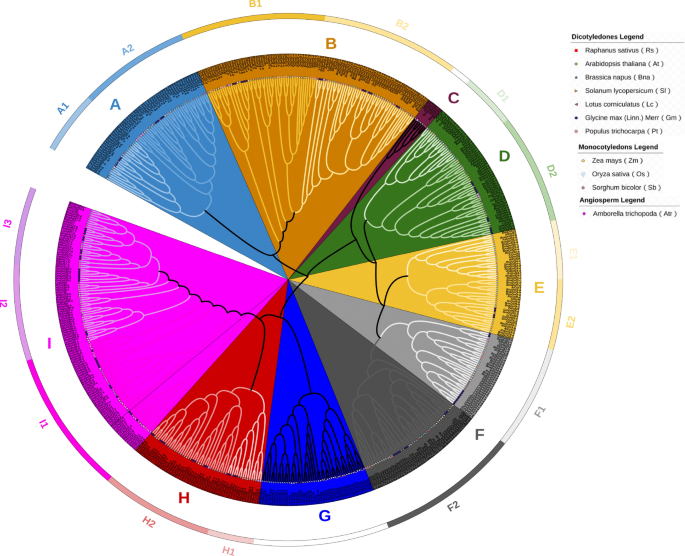
Phylogenetic tree of Dof proteins in Amborella trichopoda, Sorghum bicolor, Zea mays, Solanum lycopersicum, Oryza sativa, Lotus corniculatus, Glycine max, Populus trichocarpa, Arabidopsis thaliana, Brassica napus and Raphanus sativus. This phylogenetic tree was generated using the neighbor-joining method with 1000 bootstraps in MEGA. Eleven Dof subfamilies were classified with different colors, and their names are marked in the corresponding positions. The circle, five-pointed star, and square text indicate A. thaliana, B. napus, and R. sativus proteins, respectively.
Chromosome distribution, gene duplication, and Synteny analysis of RsDofs
To elucidate the evolutionary mechanisms underlying the expansion of RsDofs genes in radish, their chromosomal localization and gene duplication events were investigated. The analysis revealed an uneven distribution of RsDofs on the chromosomes, with 59 RsDofs identified across nine chromosomes. Notably, Chr 5 harbored the highest number of RsDofs (10), while Chr 3 contained the fewest (2) RsDof genes (Fig. 3). Furthermore, the study identified 30 segmental duplications and two sets of tandem duplication (RsDof24-f–RsDof24-d and RsDof24-e–RsDof24-b) among RsDofs gene pairs. These duplication events are likely key contributors to the expansion of the gene family in radish (Fig. 3, Table S3).
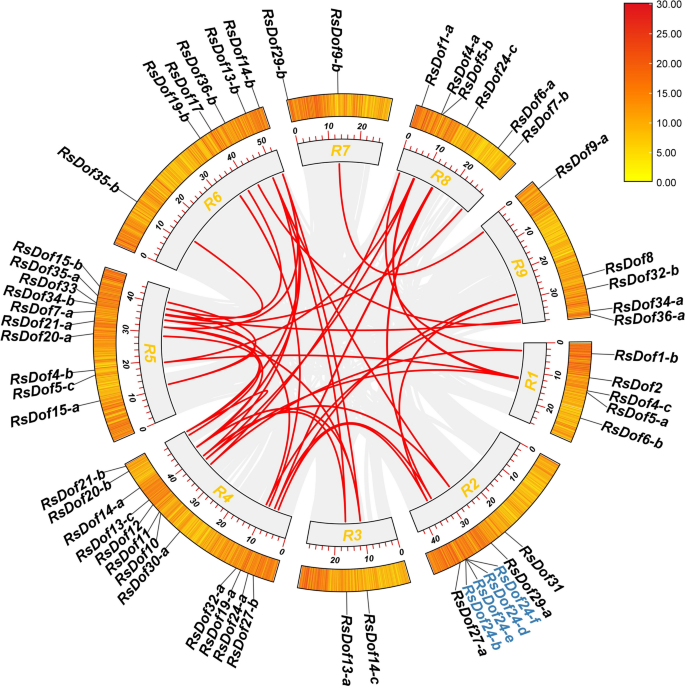
Chromosomal locations of RsDof genes and synteny analysis of interchromosomal relationships of RsDof genes in radish. The gray blocks indicate parts of the radish chromosomes. The red lines indicate segment duplicated RsDof gene pairs. Blue text indicates tandem duplicated RsDof gene pairs.
Gene structure and conserved motifs of RsDofs
To assess the diversity and conservation of the 59 RsDofs genes in radish, their conserved motifs were analyzed using MEME, resulting in the prediction of ten distinct motifs (ranging from 19 to 50) (Figure S1). Notably, Motif 1 was identified as the conserved structural domain of Dof, characterized by the CX2CX21CX2C single zinc finger structure. Additionally, comparable motif structures of RsDofs proteins were observed within evolutionary branches of the phylogenetic tree, indicating conservation among certain motif structures.
The distribution of motifs revealed distinct patterns among subgroups, with motifs 10, 7, 5, and 7 exclusives to the B1 subgroups, motifs 2 and 10 to the B2 subgroups, and motifs 8 and 4 to the C3 and A subgroups, respectively (Fig. 4A,B). Furthermore, analysis of intron–exon structures indicated minimal variation in the number of introns (ranging from 0 to 1) among RsDof genes. Specifically, 26 and 33 RsDofs members were found to possess either one or no introns, predominantly located upstream of the Dof structural domain (zf-dof) (Fig. 4C). This was further supported by the phylogenetic tree, which demonstrated similar exon–intron patterns within the same gene groups.
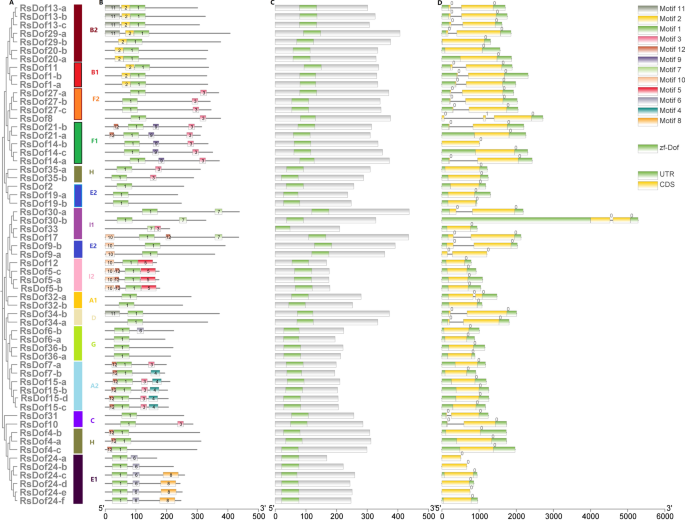
Structural analysis of Dof genes in radish. (A) a phylogenetic tree of RsDof protein was generated using the neighbor-joining method with 1000 bootstraps in MEGA. (B) MEME (suite 4.11.4) was used to identify the conserved motifs based on the RsDof protein sequences, and a colored box numbered (1 to 20) is indicated in each motif at the bottom. (C) The Dof domain was identified using NCBI CD-hit, the Dof domain was constructed using TBtools software, and different groups of the Dof family are divided with different colors. (D) Exon–intron structure of RsDOF genes. Green boxes indicate untranslated 5′- and 3′-regions; yellow boxes indicate exons; black lines indicate introns.
Promoter analysis of RsDof genes
In order to elucidate the transcriptional regulation by RsDof gene family members, the cis-regulatory elements within their promoters were investigated. Notably, essential elements such as the TATA-box and CAAT-box were identified in all RsDof genes, while elements associated with plant growth and development, including Zein metabolism regulation (O2-site) and meristem expression (CAT-box), were also prevalent. Moreover, a diverse array of phytohormone-responsive elements, such as ABREs for abscisic acid, TGACG-motif and CGTCA-motif for MeJA, TCA-element for salicylic acid, and P-box for gibberellin, were observed in the promoters of RsDof genes.
This suggests that RsDof genes are subject to regulation by various phytohormones and potentially participate in plant hormone signaling pathways. Furthermore, the presence of elements responsive to anaerobic induction (ARE), light responsiveness (G-box, GT1-motif, Box-4, and AE-box), as well as defense and stress response elements (TC-rich) in the promoters of RsDof genes further indicates their involvement in plant growth, development, stress responses, and defense mechanisms. In summary, the analysis of cis-regulatory elements in the promoters of RsDof genes underscores their involvement in diverse biological processes, including plant growth and development, stress responses, and phytohormone signaling pathways (Fig. 5, Table S4).
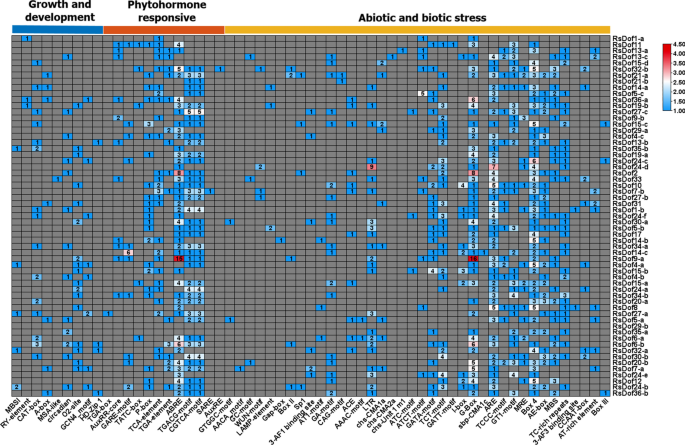
Prediction of cis-regulatory elements in the promoter regions of the RsDof gene family. Different cis-elements are represented by different colors. Cis-element analysis of the promoter sequences (1500 bp) upstream of the RsDof genes was performed using PLACE (http://www.dna.affrc.go.jp/PLACE/.)
Expression patterns of RsDofs in different tissues of radish
The RNA-seq data revealed three distinct groups of Dof genes based on their expression patterns in different tissues of the carmine radish. Group 1 Dof genes were primarily expressed in the pulps, while Group 2 genes were specifically expressed in the flowers and inflorescences. Meanwhile, Group 3 encompassed genes with tissue-specific expression in various parts of the plant, such as the pericarp, flower, leaf, and inflorescence. For group 1, most of the RsDofs were specially expressed in pulps of carmine radish, including RsDof1-a, RsDof1-b, RsDof33, RsDof35-a, RsDof13-a, RsDof27-c, RsDof31, RsDof15-d, RsDof7-b, RsDof24-c, RsDof13-b, RsDof15-a, RsDof29-a, and RsDof27-b.
For group 2, most of RsDofs were specially expressed in flower (RsDof4-a, RsDof14-c, RsDof34-b, RsDof17, RsDof11, RsDof21-b, RsDof5-c, RsDof13-c, RsDof21-a, RsDof5-b, RsDof9-b, RsDof14-a) and inflorescence (RsDof34-a, RsDof19-b, RsDof5-a, RsDof4-a, RsDof17) of carmine radish. For group 3, different RsDofs were specially expressed in different tissues, including RsDof2 and RsDof32-b in pericarp, RsDof32-a, RsDof4-c, RsDof30-a and RsDof9-c in flower, RsDof10, RsDof4-c, RsDof30-a and RsDof9-c in leaf, and RsDof32-a, RsDof24-d, RsDof24-b, RsDof36-a, RsDof29-b and RsDof35-b in flower respectively. Notably, flowers and pulps were found to be the primary sites of Dof gene expression, suggesting their significant roles in flower development and the biosynthesis of anthocyanins. (Fig. 6, Table S5).
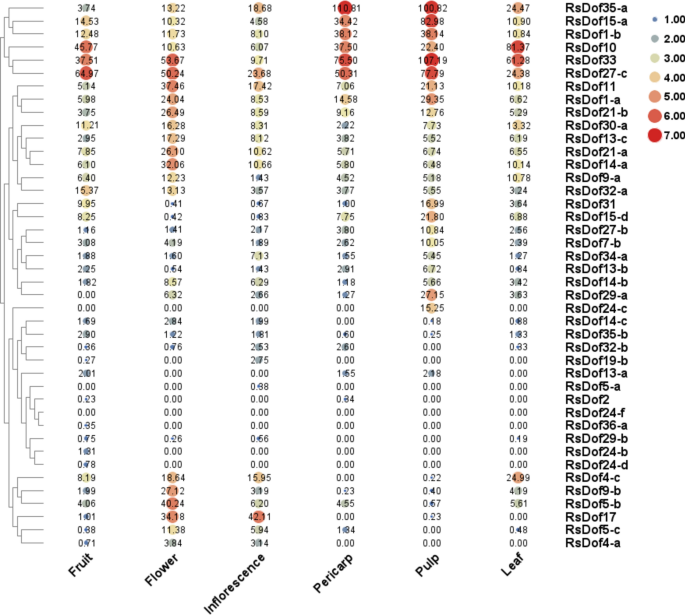
Heatmap and hierarchical clustering of RsDof genes in florescence, fruit, flower, leaf, pericarp and pulp. The expression values were calculated by RPKM measurement, and log2 transformed before generating heatmaps.
Responses of RsDOfs genes to heavy metal cadmium (Cd) treatments
The study investigated the modulation of RsDof gene expression in response to heavy metal stress in radish, utilizing transcriptome data from the heavy metal-tolerant cultivar ‘XCB’ and the heavy metal-susceptible cultivar ‘HX.’ Hierarchical clustering analysis was employed to analyze the expression patterns of RsDof genes. Notably, several RsDof transcripts exhibited significant alterations in response to cadmium stress, including RsDof5-b, RsDof35-a, RsDof15-a, RsDof1-a, RsDof13-b, RsDof14-a, RsDof14-b, RsDof30-a, RsDof32-b, RsDof17, RsDof9-a, and RsDof11, RsDof21-a, RsDof21-b, RsDof33, RsDof32-a, RsDof14-a, and RsDof9-b et al.,) (Fig. 7A, Table S6).
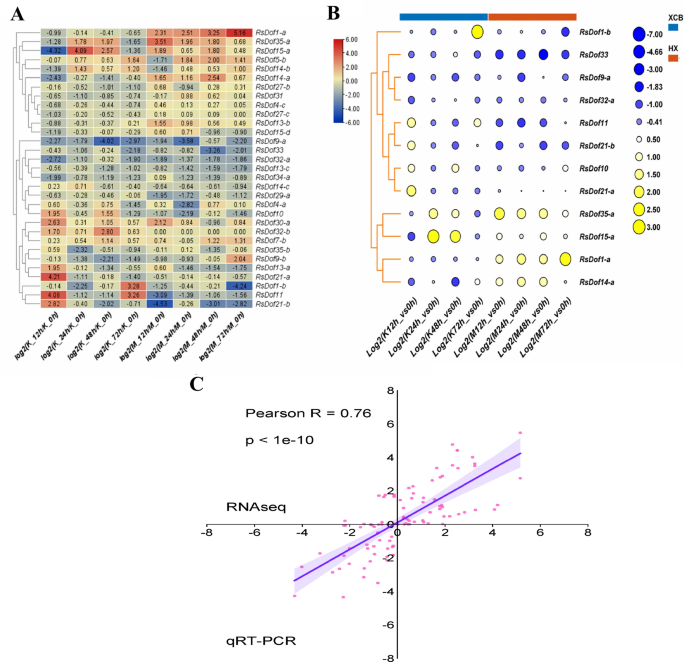
Responses of RsDOfs genes to Cd treatments in two contrast cultivars. (A) Heatmap and hierarchical clustering of RsDof genes responsive to Cd stress in two cultivars under a series of treatments. (B) The expression patterns of the candidate RsDof genes (RsDof1-a, RsDof1-b, RsDof33, RsDof35-a, RsDof13-a, RsDof27-c, RsDof31, RsDof15-d, RsDof7-b, RsDof24-c, RsDof13-b, RsDof15-a, RsDof29-a and RsDof27-b) in two cultivars responsive to Cd stress were validated using qRT-PCR technology. Three independent biological repeats were performed, and all data points are the means of three biological replicates ± standard error (SE). (C). Correlation between RNA-seq and qRT-PCR data was conducted. Each RNA-seq expression data was plotted against that from quantitative real-time PCR and fit into a linear regression. Both x- and y-axes were shown in log2 scale.
Of those, the key roles of these genes (RsDof35-a, RsDof15-a, RsDof1-a, RsDof1-b, RsDof10, RsDof11, RsDof21-a, RsDof21-b, RsDof33, RsDof14-a, RsDof9-a, and RsDof32-a) responsive to Cd heavy metal stress were validated by qRT-PCR. The qRT-PCR results revealed significant up-regulation of RsDof35-a and RsDof15-a in the ‘HX’ cultivar under cadmium stress while exhibiting complex expression dynamics in the ‘XCB’ cultivar over different treatment durations. Conversely, RsDof1-a and RsDof14-a showed significant up-regulation in the ‘HX’ cultivar but down-regulation in the ‘XCB’ cultivar under cadmium stress. Additionally, RsDof1-b, RsDof11, RsDof21-b, RsDof10, and RsDof21-a were down-regulated in the ‘HX’ cultivar under cadmium stress, with varying expression patterns observed in the ‘XCB’ cultivar. Notably, RsDof33, RsDof9-a, and RsDof32-a were consistently down-regulated in both radish cultivars, indicating their putative negative regulatory roles in response to heavy metal stress (Fig. 7B). Correlation between the RNA-seq and qPCR data indicated that both results were basically consistent for gene expression profiles (Fig. 7C, R = 0.76), which confirmed the high reliability of the RNA-seq data obtained in our study.
Expression profiles of the candidate RsDof genes related to anthocyanin biosynthesis
To investigate the key roles of these genes in anthocyanin biosynthesis, young fleshy roots of the carmine radish “Hongxin 1” were used for RNA-Seq validation at different stages of fleshy root development ((seedling stage (SS), initial expansion (IE), full-expansion (FE), bolting stage (BS), initial. flowering stage (IFS); full-bloom stage (FBS) and podding stage (PS))). The expression patterns of RsDof genes were compared to the dynamics of anthocyanin profiles in the fleshy roots. The results showed that the transcripts of RsDof35-a, and RsDof33 were upregulated in various growth stages of fleshy roots, from initial expansion to full bloom, but decreased in the podding stage. This pattern was consistent with the dynamics of anthocyanin profiles in the fleshy roots of carmine radish, particularly for RsDof33 (Fig. 8A,B). RsDof1-b and RsDOf1-a were found to have a significant decrease from the seedling stage (SS) to the bolting stage (BS), followed by an increase. On the other hand, the expression of RsDof32-a was significantly increased from the seedling stage (SS) to full expansion (FE) and then increased. For the transcript of RsDof14-a and RsDof9-a, which showed similar trends (increased from SS to IE, and then decreased to FE, increased FE to FBS, and last decreased to PS stage), and RsDof15-a and RsDof21-a were significantly enriched only in the seedling stage, while RsDof21-a was more enriched in both the seedling stage and initial expansion stage. RsDof10 and RsDof11 were more enriched in the seedling stage, initial expansion stage, and full bloom stage, and the seedling stage, initial expansion stage, and initial flowering stage, respectively (Fig. 8A). Overall, the expression patterns of RsDof33 showed consistency with the dynamics of anthocyanin profiles in the fleshy roots of carmine radish, suggesting that RsDof33 may play a role in the regulatory mechanism of anthocyanin synthesis in the fleshy roots.
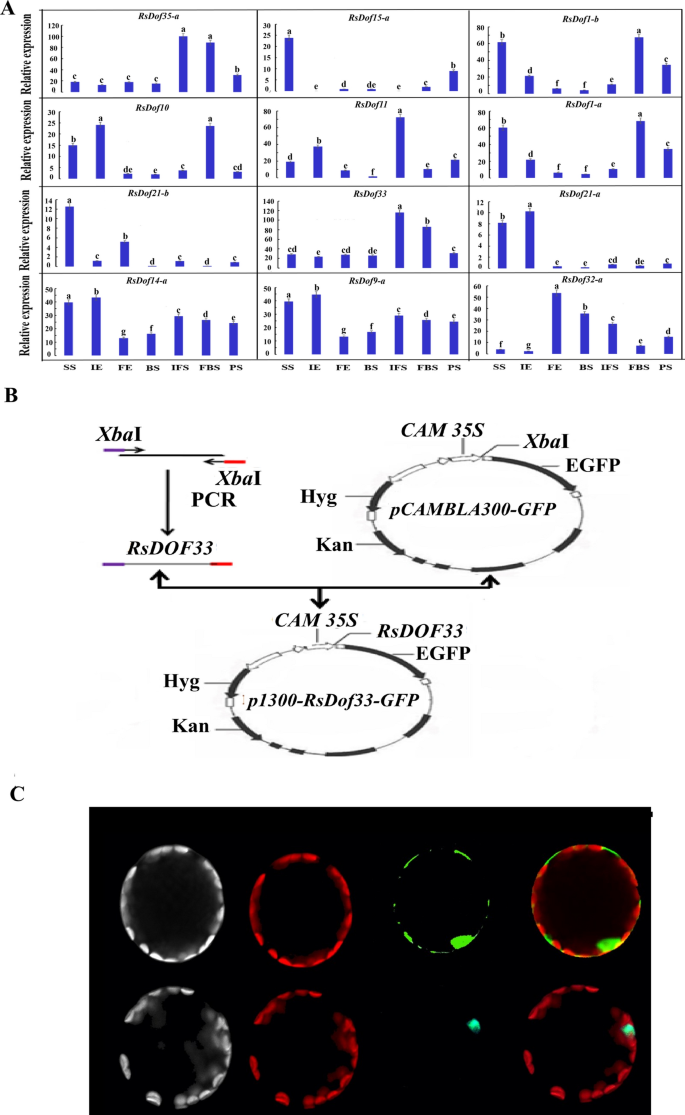
Expression profiles of the candidate RsDof genes related to anthocyanin biosynthesis and Sub-localisation analysis of RsDof33 genes. (A)The expression patterns of the candidate RsDof genes (RsDof1-a, RsDof1-b, RsDof33, RsDof35-a, RsDof13-a, RsDof27-c, RsDof31, RsDof15-d, RsDof7-b, RsDof24-c, RsDof13-b, RsDof15-a, RsDof29-a, and RsDof27-b) in the pulp of fleshy roots obtained from the dynamics development stage of fleshy roots (seedling stage (SS), initial expansion (IE), full-expansion (FE), bolting stage (BS), initial. flowering stage (IFS); full-bloom stage (FBS) and podding stage (PS)) in carmine radish “””Hongxin 1″”” using qRT-PCR. Relative gene expression levels were normalized against actin transcript levels, and log2 scale for fold change of gene expression in the development stage of fleshy roots comprising of “”“SS”””, ““IE””, “FE”,” “BS”,” “IFS”,” “FBS” and “PS” was shown. The standard error calculated from three biological replicates and significant (P < 0.05) difference identified by uncorrected Fisher’s LSD test in multiple comparisons after two-way ANOVA are indicated by error bars and stars, respectively. (B) Digram of Vector construction of p1300-RsDof 33-GFP. C Sub-localisation analysis of RsDof 33 TF.
Additionally, it was found that RsDof33 was responsive to Cd stress. Therefore, RsDof33 was selected for further gene function analysis in carmine radish. An expression plasmid containing RsDof33 with a GFP reporter and a CMV35S promoter was constructed (Fig. 8B). and then transformed into Arabidopsis protoplasts. The recombinant fusion protein RsDof33-GFP was observed to be localized in the nucleus and dispersed into the cytoplasm as small granules using laser confocal microscopy (Fig. 8C).
Correlation network analysis for anthocyanin biosynthesis genes, RsDOF transcription factors, and anthocyanin metabolisms
In the study of radish RsDOF gene regulation, metabolomics data identified four metabolites (Pelargonidin-3-O-glucoside, Cyanidin-3-O-glucoside, Pelargonidin-3,5-O-diglucoside, and Peonidin-3-O-rutinoside), alongside 12 anthocyanin biosynthesis genes (Rs4CL3, RsC4H2, RsCHI3, RsCHS1, RsFLS5, RsMYB113.2, RsPAL1.1, RsPAL1.4, RsPAL1.5, RsPAL2, RsTT8.1, and RsTT8.2) and four RsDOF transcription factors (RsDof33, RsDof30a, RsDof20a, RsDof9a), across diverse radish cultivars ( WW_NM (white radish white skin and white flesh root, WW), HX-1 (Hongxin red skin and white flesh root, RW), HX-2 (Hongxin red skin and pinky flesh root, RP), HX-3 (Hongxin red skin and red flesh root, RR), WG-1 (Waguan red skin and white flesh root, RW), WG-2(Waguan red skin and pinkly flesh root, RP), and WG-3 (Waguan red skin and red flesh root, RR) (Fig. 9A,B). A network integrating these elements and relevant miRNAs exhibited limited significant associations, except for specific interactions such as miR8005e-RsDOf33 (Fig. 9C).
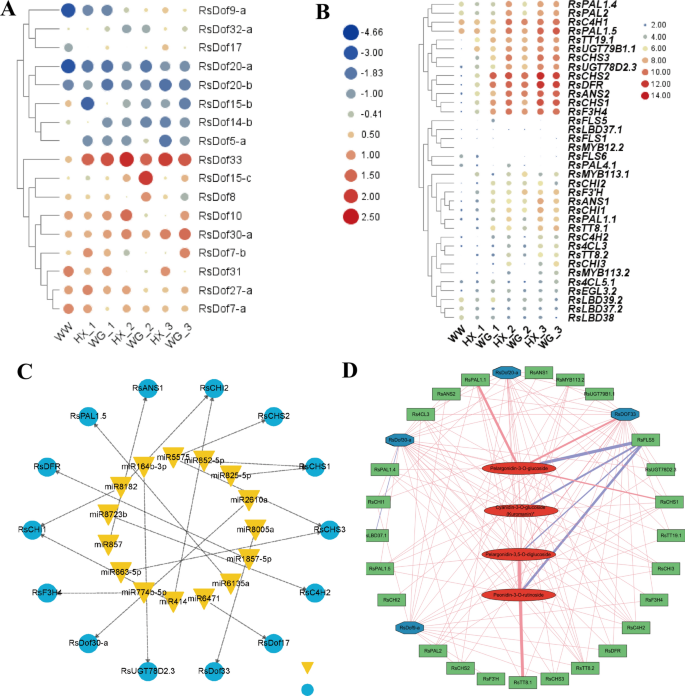
Correlation network analysis was performed involving structural genes, RsDOF transcription factors, and anthocyanin content. (A) The expression patterns of 17 candidate RsDof genes in diverse radish cultivars. (B)The expression patterns of anthocyanin biosynthesis genes in diverse radish cultivars. (C) A network integrating the candidate RsDof genes and anthocyanin biosynthesis genes with relevant miRNAs. (D) A correlation network incorporating the four metabolites, 12 anthocyanin biosynthesis genes, and four RsDOF TFs was established. Anthocyanin metabolism was represented by red ellipse boxes, RsDOF transcription factors by blue ellipse boxes, and anthocyanin biosynthetic genes by green diamond boxes. Red solid linesRed solid lines denoted positive regulation, while blue lines indicated negative regulation. Edges were depicted when the linear correlation coefficient exceeded 0.8 with a p-value below 0.05.
Subsequently, a correlation network was established, incorporating the four metabolites, 12 anthocyanin biosynthesis genes, and four RsDOF TFs, which revealed Pearson correlation coefficients exceeding 0.8 (Fig. 9D). Notably, positive correlations with anthocyanin contents were observed for 11 anthocyanin biosynthesis genes, with RsPAL1.1, RsCHS1, and RsTT8.1 exhibiting the highest positive correlations. At the same time, RsFLS5 displayed negative correlations with anthocyanin contents (Table S7). Among the RsDOF TFs, alterations in transcript levels were noted for RsDof33, RsDof30a, RsDof20a, and RsDof9a, with RsDof33 showing the strongest positive correlation. Significant correlations were observed between RsDof33 and the 11 anthocyanin biosynthesis genes, followed by RsDof30a, RsDof20a, and RsDof9a (Table S8). Furthermore, robust positive associations were identified between levels of RsDof33, RsDof30a, RsDof20a, and RsDof9a with anthocyanin biosynthesis genes (Table S9), implying the potential involvement of RsDof33 in regulating anthocyanin biosynthesis.
Overexpression of RsDof33 decreases rosette leaf number and shortens flowing time, as well as anthocyanin biosynthesis in A. thaliana
To functionally understand the involvement of RsDOf33 in plant growth and development, we generated RsDOf33-overexpressing (OE) plants. Compared to wild-type (WT) plants, the overexpression lines exhibited different growth phenotypes, as shown in Fig. 9A. Among these lines, OE1 (Leaf number: 8), OE7 (6), and OE-1 (4) had fewer rosette leaves but promoted early flowering, with OE8 showing the most significant effect (Fig. 10A). We found anthocyanin enriched in OE1, OE7, and OE-8, respectively, especially for OE-8. On the other hand, OE3 (14), OE4 (12), and OE6 (12) had a similar number of rosette leaves and moderately promoted early flowering. Lastly, OE2 (20) and OE5 (18) had more rosette leaves but only slightly promoted early flowering. To further analyze the relative expression level of the RsDOf33 gene, qRT-PCR was performed on the transgenic pure lines (OE1, OE2, OE3, OE4, OE5, OE6, and OE7).
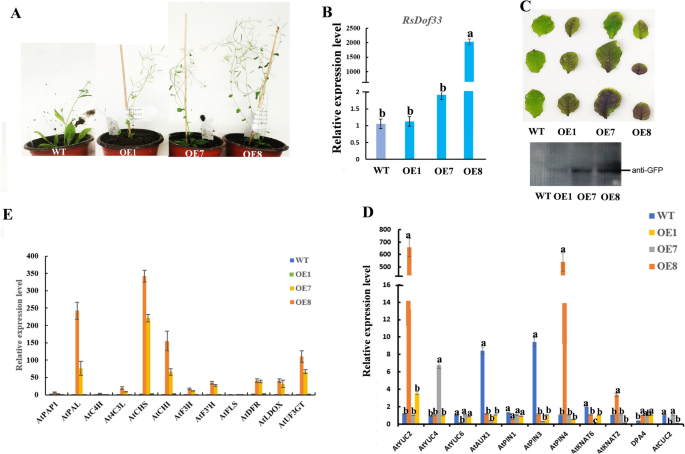
RsDof33 regulates rosette leaf number by upregulating the expression of some genes related to auxin and leaf shape development and anthocyanin biosynthesis. (A) Different growth phenotypes in overexpression line plants. (B) QRT-PCR further analyzed the relative expression level of RsDof33 for those transgenic pure lines. (C) Western bolting (WB) detection of RsDOf33 protein in the OE1 transgenic lines, followed by OE7 and OE8. (D). The expression levels of auxin biosynthetic genes (AtYUC2, AtYUC4 and AtYUC6), auxin transport genes (AtAUX1, AtPIN1, AtPIN3, and AtPIN4), as well as genes related to leaf shape development (AtKNAT2, AtKNAT6, AtDPA4, and AtCUC2) were examined in OE plants. (E). The expression levels of anthocyanin biosynthetic genes were examined in OE plants.
The results indicated a significant increase in RsDOf33 gene expression in the OE8 transgenic lines, followed by OE7 and OE1 (Fig. 10B,C , Figure S2). This suggests that higher expression of the RsDOf33 TF makes the plants more susceptible to promoting early flowering and increasing anthocyanin accumulation but reduces the number of rosette leaves (Fig. 10A,C, Figure S3). Previous studies have underscored the pivotal role of auxin in leaf development. Hence, we delved into whether RsDOf33 governs leaf development by modulating auxin signaling. We scrutinized the expression levels of auxin biosynthetic genes (AtYUC2, AtYUC4, and AtYUC6), auxin transport genes (AtAUX1, AtPIN1, AtPIN3, and AtPIN4), and genes associated with leaf shape development (AtKNAT2, AtKNAT6, AtDPA4, and AtCUC2). Our analysis unveiled a notable rise in the transcript levels of the auxin biosynthetic gene YUCCA (AtYUC2) and an auxin efflux carrier (AtPIN4) in plants expressing RsDOf33 compared to wild-type Arabidopsis thaliana plants.
Conversely, the expression levels of auxin transport genes (AtAUX1) and auxin efflux carriers (AtPIN3) were diminished (Fig. 10D). Moreover, we noted a significant elevation in the transcript levels of the leaf shape development gene AtKNAT2 in 35S::RsDOf33 plants (OE8) in comparison to wild-type A. thaliana plants (Fig. 10D).
To assess whether RsDof33 regulates anthocyanin biosynthesis, we validated the relative expression levels of anthocyanin biosynthesis-related genes (DFR, PAP1, PAL, C4H, 4CL3, CHS, CHI, F3H, F3’H, FLS, LDOX, and UF3GT) in A. thaliana. Our findings indicated significantly augmented transcript levels of the anthocyanin biosynthesis-related genes AtPAL, AtCHS, AtCHI, AtDFR, AtLDOX, and AtUF3GT in RsDOf33-expressing plants compared to wild-type A. thaliana plants, particularly in OE8. At the same time, AtFLS exhibited decreased expression (Fig. 10E).
These outcomes suggest that the alterations induced by RsDOf33 in auxin biosynthesis and polar transport could impact leaf development and anthocyanin biosynthesis. The up-regulation of specific genes linked to leaf shape development and anthocyanin biosynthesis potentially influences rosette leaf number and anthocyanin content in A. thaliana.


