
Growth attributes
The application of 25 µM SLs resulted in ~ 9% and 25 µM SLs + 0.75% AB showed a ~ 19% increase in shoot length over the control under no Cd stress. Compared to control, 0.75% AB exhibited a ~ 31% enhancement in shoot length at no Cd stress. In 20Cd stress, the treatment SLs showed a ~ 11%, 25 µM SLs + 0.75% AB led to ~ 17%, while 0.75% AB resulted in a ~ 29% improvement in shoot length over the control (Fig. 1A).
The impact of SLs and biochar on radish shoot and root length (A), plant fresh and dry weight (B) grown in no Cd and 20Cd stress. The graph shows the average of 4 replicates with±, where significant differences (p ≤ 0.05) are indicated by distinct letters on bars, determined by the Tukey test.
At no Cd stress, applying 25 µM SLs, 0.75% AB and 25 µM SLs + 0.75% AB led to a ~ 10, ~ 61 and ~ 32% enhancement respectively in root length than control. Under Cd stress (20Cd), an improvement of ~ 30, ~ 58, ~ 47% was observed in root length where 25 µM SLs, 0.75% AB and 25 µM SLs + 0.75% AB were applied as treatment compared to control respectively (Fig. 1A).
An enhancement of ~ 5, ~ 12 and ~ 20% in plant fresh weight was noted in 25 µM SLs, 0.75% AB and 25 µM SLs + 0.75% AB than control respectively. In case of 20Cd stress, SLs resulted in a ~ 5% while 25 µM SLs + 0.75% AB caused ~ 28% improvement in plant fresh weight over control. On the other hand, AB treatment showed ~ 17% improvement in plant fresh weight compared to control under 20Cd stress (Fig. 1B).
In no Cd stress, the addition of 25 µM SLs resulted in ~ 8% improvement in the plant dry weight than control. When 25 µM SLs + 0.75% AB and 0.75% AB were applied, the plant dry weight exhibited a ~ 28 and ~ 17% enhancement over control under no Cd stress. In the presence of 20Cd stress, SLs treatment caused ~ 35%, 25 µM SLs + 0.75% AB ~ 96% and 0.75% AB ~ 57% rise in plant dry weigh over the control (Fig. 1B).
Chlorophyll and carotenoid contents
Applying 20 µM SLs, 25 µM SLs + 0.75% AB and 0.75% AB showed ~ 33, ~ 24 and ~ 14% improvement in chlorophyll a content than control at no Cd stress. In 20Cd stress, treatments 25 µM SLs showed a ~ 54%, 25 µM SLs + 0.75% AB caused ~ 43% and 0.75% AB led to ~ 21% improvement in chlorophyll a content over control (Fig. 2).
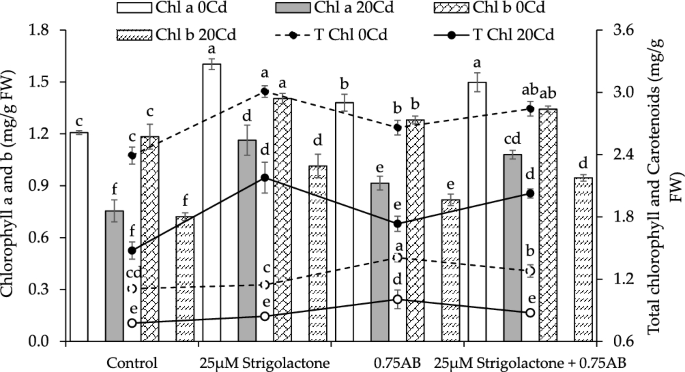
The influence of SLs and biochar on the radish leaves chlorophyll a, b, total and carotenoids grown in no Cd and 20Cd stress. The graph shows the average of 4 replicates with±, where significant differences (p ≤ 0.05) are indicated by distinct letters on bars, determined by the Tukey test.
In no Cd stress, chlorophyll b contents were improved by ~ 19% with 25 µM SLs, ~ 13% with 25 µM SLs + 0.75% AB, and ~ 8% with 0.75% AB over control. Under 20Cd stress, chlorophyll b contents were enhanced by ~ 41% with 25 µM SLs, ~ 31% with 25 µM SLs + 0.75% AB, and ~ 14% with 0.75% AB compared to control (Fig. 2).
The total chlorophyll content improved by ~ 26% in 25 µM SLs, ~ 19% in 25 µM SLs + 0.75% AB and ~ 11% in 0.75% AB over the control at no Cd stress. Under 20Cd stress, 25 µM SLs caused ~ 48%, 25 µM SLs + 0.75% AB resulted in ~ 37% and 0.75% AB showed ~ 18% improvement in total chlorophyll contents over control (Fig. 2).
At no Cd stress, 25 µM SLs led to ~ 3% while 25 µM SLs + 0.75% AB caused ~ 15% improvement in carotenoids over the control. However, 0.75% AB showed ~ 27% enhancement in carotenoids from control under no Cd stress. In 20Cd stress, 25 µM SLs showed an improvement of ~ 8%, 25 µM SLs + 0.75% AB resulted in ~ 13% while 0.75% AB caused ~ 30% enhancement in carotenoids than control (Fig. 2).
Relative water contents, protein content, and electrolyte leakage
Treatment 25 µM SLs led to ~ 5% improvement in relative water contents (RWC) from control, while 25 µM SLs + 0.75% AB caused ~ 18% increment in RWC in no Cd stress. The 0.75% AB showed a ~ 13% improvement in RWC over control in no Cd stress. Under 20Cd stress, applying 25 µM SLs caused ~ 6%, 25 µM SLs + 0.75% AB ~ 23% and 0.75% AB led to ~ 16% improvement in RWC than control (Fig. 3A).
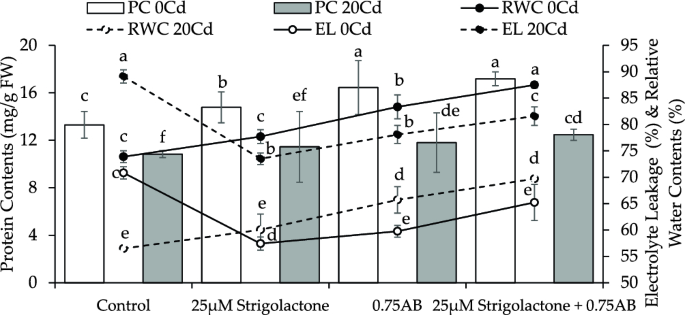
The impact of SLs and biochar on radish protein content, electrolyte leakage, and relative water content grown in no Cd and 20Cd stress. The graph shows the average of 4 replicates with ± , where significant differences (p ≤ 0.05) are indicated by distinct letters on bars, determined by the Tukey test.
The protein content in no Cd stress showed a ~ 11% improvement in 20 µM SLs while ~ 29% where 25 µM SLs + 0.75% AB was applied over control. The addition of 0.75% AB treatment resulted in a ~ 24% improvement in protein content compared to control. In 20Cd stress, protein content showed ~ 6, ~ 15 and ~ 9% improvement in protein content where 25 µM SLs, 25 µM SLs + 0.75% AB and 0.75% AB were applied as treatment respectively than control (Fig. 3B).
Under no Cd stress, 25 µM SLs, 0.75% AB and 25 µM SLs + 0.75% AB led to a ~ 19, ~ 16 and ~ 8% decrease in electrolyte leakage (EL) respectively, compared to control. In 20Cd stress, 25 µM SLs led to a ~ 18%, 25 µM SLs + 0.75% AB caused ~ 8% while 0.75% AB resulted in ~ 12% decrease in EL over control (Fig. 3C).
Proline content, H2O2, and MDA
Results showed that H2O2 was decreased ~ 7, ~ 29 and ~ 17% when 25 µM SLs, 25 µM SLs + 0.75% AB and 0.75% AB were applied as treatment respectively over control at no Cd stress. In 20Cd stress, H2O2 was declined ~ 6, ~ 15 and ~ 11% in 25 µM SLs, 25 µM SLs + 0.75% AB and 0.75% AB respectively than control (Fig. 4).
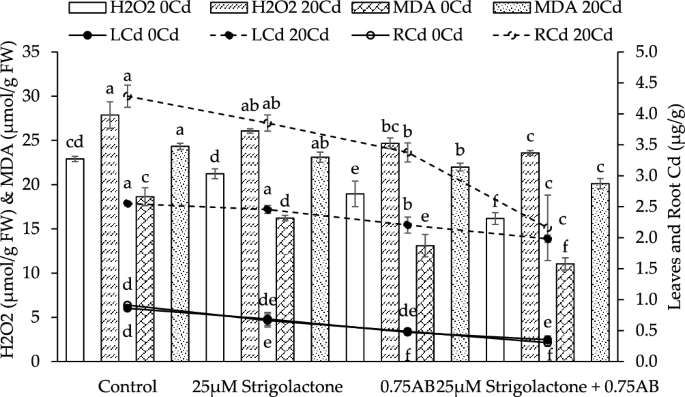
The impact of SLs and biochar on radish H2O2, malondialdehyde, leaf and root Cd concentration grown in no Cd and 20Cd stress. The graph shows the average of 4 replicates with±, where significant differences (p ≤ 0.05) are indicated by distinct letters on bars, determined by the Tukey test.
It was noted that 25 µM SLs reduced ~ 13%, 25 µM SLs + 0.75% AB ~ 41% and 0.75% AB ~ 30% MDA over control at no Cd stress. In case of 20Cd stress, 25 µM SLs decreased ~ 5%, 25 µM SLs + 0.75% AB ~ 17% and 0.75% AB ~ 10% MDA compared to control (Fig. 4).
In case of leaves Cd concentration was decreased ~ 20, ~ 59 and ~ 145% when 25 µM SLs, 25 µM SLs + 0.75% AB and 0.75% AB were applied as treatment respectively over control at no Cd stress. In 20Cd stress, leaves Cd concentration was declined ~ 4, ~ 22 and ~ 14% in 25 µM SLs, 25 µM SLs + 0.75% AB and 0.75% AB respectively than control (Fig. 4).
It was noted that 25 µM SLs reduced ~ 27%, 25 µM SLs + 0.75% AB ~ 67% and 0.75% AB ~ 47% roots Cd concentration over control at no Cd stress. In case of 20Cd stress, 25 µM SLs decreased ~ 10%, 25 µM SLs + 0.75% AB ~ 50% and 0.75% AB ~ 21% roots Cd concentration compared to control (Fig. 4).
Antioxidants activities
When compared to control, the addition of 25 µM SLs led to ~ 20%, 25 µM SLs + 0.75% AB caused ~ 57% while 0.75% AB showed ~ 47% decrease in SOD activity than control. In the 20Cd stress, a decrease of ~ 11, ~ 31 and ~ 20% in SOD activity was observed in 25 µM SLs, 25 µM SLs + 0.75% AB and 0.75% AB compared to control (Fig. 5).
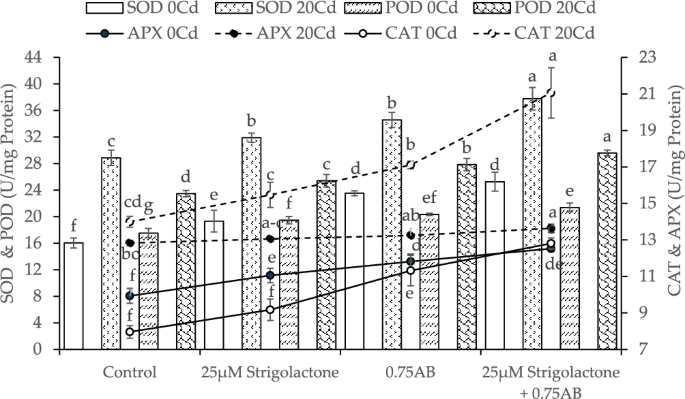
The impact of SLs and biochar on superoxide dismutase (SOD), peroxidase (POD), catalase (CAT), and ascorbate peroxidase (APX) levels in radish grown in no Cd stress and 20Cd stress. The graph shows the average of 4 replicates with±, where significant differences (p ≤ 0.05) are indicated by distinct letters on bars, determined by the Tukey test.
In no Cd stress, treatment 25 µM SLs resulted in ~ 11%, 25 µM SLs + 0.75% AB led to ~ 22% and 0.75% AB caused ~ 16% decrease in POD activity than control under no Cd stress. At 20Cd stress, applying 25 µM SLs showed ~ 8%, 25 µM SLs + 0.75% AB demonstrated ~ 26% while AB exhibited ~ 19% decrease in POD activity, compared to control (Fig. 5).
Results showed a ~ 15, ~ 61 and ~ 42% decline in CAT activity compared to control where 25 µM SLs, 25 µM SLs + 0.75% AB and 0.75% AB were applied respectively. In case of 20Cd stress, 25 µM SLs, 25 µM SLs + 0.75% AB and 50% caused ~ 11, ~ 51 and ~ 22% decrease in CAT activity over control respectively (Fig. 5).
In case of no Cd stress, APX activity was declined up to ~ 38, ~ 88 and ~ 64% in 20 µM SLs, 25 µM SLs + 0.75% AB and 0.75% AB over control respectively. At 20Cd stress, SLs resulted in a ~ 4%, 25 µM SLs + 0.75% AB caused ~ 14% and 0.75% AB showed ~ 7% decrease in APX activity than control (Fig. 5).
Convex hull and hierarchical cluster analysis
Data points are marked with their respective treatment groups: Control, 25 µM SLs, 0.75AB, and 25 µM SLs + AB. The Control group showed a tight cluster characterized by data points with predominantly negative scores on both PC 1 and PC 2. Conversely, the 25 µM SLs treatment group forms a marked cluster, with data points showing predominantly positive scores on both PC 1 and PC 2, indicative of a treatment-specific response. Positioned between the Control and 25 µM SLs groups, the 0.75AB treatment group occupies a distinct section, suggesting a response that deviates from both treatments. Notably, the 25 µM SLs + AB treatment group forms a unique cluster, positioned prominently in the positive region of PC 1 and PC 2, underscoring its distinctive response to the combined treatment (Fig. 6A).
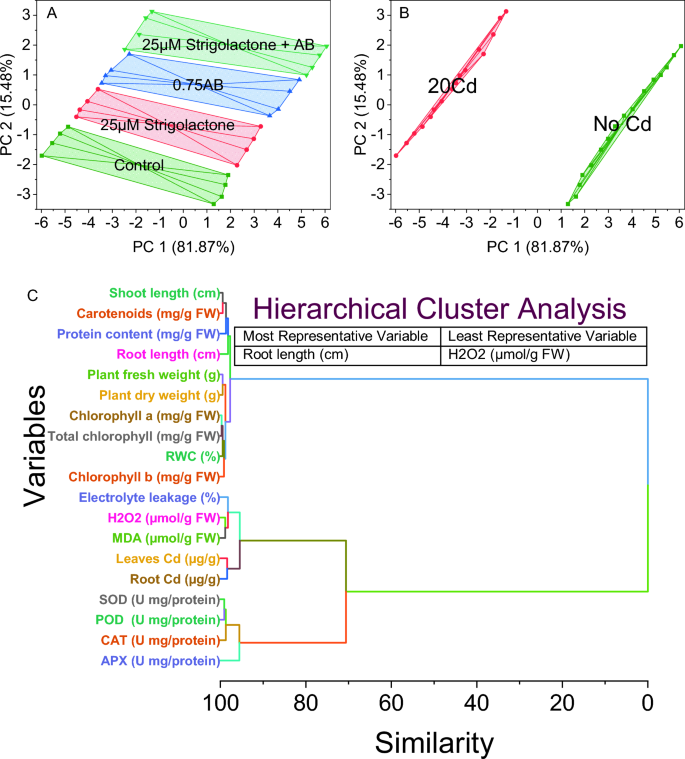
Cluster plot convex hull for treatments (A), Cd levels (B), and hierarchical cluster plot (C) for studied attributes.
In this analysis, two main clusters are identified, which correspond to different heavy metal (HM) treatments. The first cluster, labeled no Cd, encompasses data points characterized by positive values along both PC 1 and PC 2 axes. These data points exhibit increasing values along both principal components. The convex hull surrounding these points describes the boundary of this cluster, indicating the range of variation within this group. The second cluster, labeled 20Cd, includes data points characterized by negative values along both PC 1 and PC 2 axes. These data points exhibit decreasing values along both principal components (Fig. 6B).
Chlorophyll a and total chlorophyll are tightly associated, evidenced by their similarity score of 0.30045, indicating a close relationship between these two variables. RWC is clustered with a high similarity score of 0.50822, indicating a strong link to physiological parameters concerning water content. Plant fresh weight and plant dry weight exhibit a strong relationship, clustered tightly with a similarity score of 0.51475, representing plant biomass. Shoot length and carotenoids also demonstrate a notable similarity score of 0.52585, indicating shared patterns within the dataset. Chlorophyll b clusters with SOD and POD, suggesting a potential correlation between chlorophyll content and enzymatic antioxidant activities. H2O2 and MDA form a cluster with a high similarity score of 1.13996, indicating a possible association between these oxidative stress markers. CAT is grouped with root length, indicating a potential relationship between catalase activity and root development. Protein content stands separately with a similarity score of 1.321, suggesting distinct patterns compared to other variables. Leaves Cd and root Cd exhibit a high similarity score of 1.58953, suggesting a close association between cadmium concentrations in leaves and roots. Electrolyte leakage and APX are grouped with a similarity score of 1.76274, indicating at a potential link between electrolyte leakage and ascorbate peroxidase activity. Moreover, clusters with very high similarity scores, including one exceptionally high score (97.71591), denote distinct patterns or relationships within those clusters (Fig. 6C).
Pearson correlation analysis
Shoot length exhibited a perfect positive correlation with itself, as expected. Root length showed a very strong positive correlation with shoot length (r = 0.97577), indicating that as shoot length increases, root length tends to increase proportionally. Moreover, plant fresh weight and plant dry weight exhibited very strong positive correlations with both shoot and root lengths, indicating a strong association between plant size and biomass (r = 0.97994–0.99111). Chlorophyll (a. b, and total) and carotenoids all showed very strong positive correlations with each other and with plant biomass measures (r = 0.96005–0.99481). Conversely, electrolyte leakage, a measure of cellular membrane integrity, showed strong negative correlations with plant size, chlorophyll content, and biomass (r = − 0.967 to − 0.98827). Enzymatic antioxidant activities, such as superoxide dismutase (SOD), peroxidase (POD), catalase (CAT), and ascorbate peroxidase (APX), demonstrated negative correlations with most growth and physiological parameters, indicating their involvement in response to stress conditions (r = − 0.50606 to − 0.38464). Hydrogen peroxide (H2O2) and malondialdehyde (MDA), markers of oxidative stress, also exhibited strong negative correlations with most parameters, indicating their association with plant health and stress response (r = − 0.98106 to − 0.97233). Additionally, heavy metal accumulation in leaves and roots, represented by leaves Cd and root Cd, displayed strong negative correlations with various growth and physiological parameters, suggesting their detrimental effects on plant growth and health (r = − 0.95299 to − 0.93952) (Fig. 7).
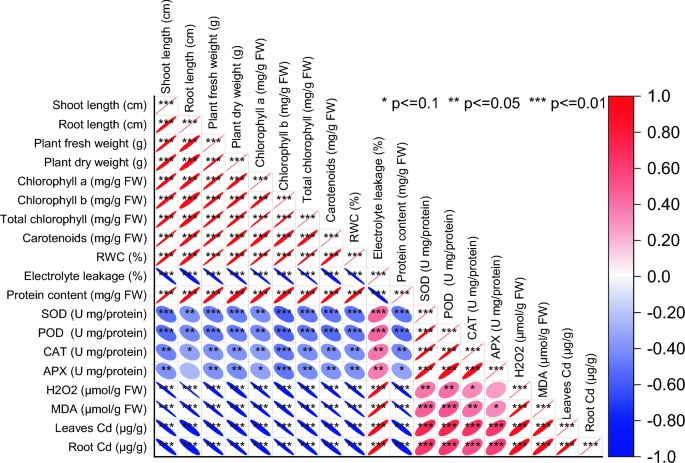
Pearson correlation for studied attributes.


